In the previous two posts on purchase events, we focussed on building data models and gaining insights from the GA4 events. But purchase is the only event with a clear equivalent in shopify (orders) and a join key (transaction_id.)
This means we can join the data from the two sources! This is how i have answered clients who wonder about data accuracy, trusting GA4 data, or trusting data models!
But there’s more to this than shutting up doubters. Let’s explore.
Getting data from shopify orders into GA4
Shopify orders table has more details about the purchase than the GA4 event. In fact, it has every detail about an order.
GA4 purchase event covers 80-95% of shopify orders depending on the users privacy settings and GTM setup. All of these can be mapped to shopify orders. Once we map the events, we can take all the details from shopify (like customers email id, first time customer or returning customer flag, payment method, tax, shipping, coupon, customer geography, and so much more) and put them in our data models.
Returning customer flag.
GA4 is not good at tracking returning users. A user who made first purchase through marketing can come back directly and GA4 will most likely tag it as a new user. The same person can come from desktop and get tagged as new user. The same person can come from from an ad on different marketing platform, and get tagged as new user.
But if a user makes a purchase, we get a purchase event for them in shopify. And here, we can find out if it’s a first time purchaser.
We can then pass this info back to GA4 and improve our returning users data. This can seem like futile effort – because the number of visitors is so much higher than buyers. BUT we are much more interested in buyers than other visitors.
Correcting buyer data is a huge advantage to further analysis.
Payment method and other details
Shopify orders table also adds more details to the payment information. The extent of new information depends on what you are getting in GA4 by default
Most important of these is refunds and cancellations. These are not captured in GA4. By adding this extra information, you can get an exact idea of revenue made. You can also account for losses through items shipped but returned, COD orders not completed and so on.
For some stores, this can significantly bring down the ROAS on marketing – as well as challenge existing ideas about best performing campaigns.
Complete picture with shopify data
While GA4 data is good for analysis, it is incomplete. Shopify data solves this problem. It gives you all the orders and revenue, with refunds included.
Shopify also gives you the referral site. This can be different from GA4 for many orders. This is expected. Shopify is better at tracking where a user came from than GA4. So take shopify’s data as the better of the two.
With this, you can assign the orders against your marketing campaigns on meta and google ads – and get ROAS at a campaign level, everyday.
Line items
Some of the analysis mentioned in part 2 can also be achieved through shopify orders table. This is true for analysis related to items in the order.
Data models
shopify_orders
Matches against GA4, adds more details by cleaning up shopify referral , landing page data. Also takes refunds and cancellations into account.
In the part 1 of Purchase events post, we looked at the key events and base data models based on those events.
Purchase events can be modeled in many different ways to get insights. Some of these models should be scheduled as jobs because while others can be built as needed.
In this post, we will explore common analysis on purchase events and the data models required to run these analysis.
The models covered in part 1 are required for building the models detailed in this post. I refer to the models from part 1 as base models in the post below.
Use Cases
Checkout flow by session and user.
Two metrics that define the fate of most stores: Conversion rate and average order value.
Marketing teams calculate conversion rate very simply as – conversions/sessions. But this is just one way to look at conversions. And this is a useful metric to optimise marketing budgets, or run A/B test on your checkouts.
But it’s not a good metric for building your product.
Users don’t just come to your store for the first time and convert. They go through an entire journey from awareness -> purchase over several sessions, sometimes spread over days or weeks (for higher ticket purchases.).
To get actionable insights, you need to zoom in and zoom out from this metric. Let’s zoom in first.
Checkout flow
The base checkout_flow model is the zoomed in version of conversion rate. it has one row for every checkout initiation by the user.
A checkout initiation happens every time users click on ‘Checkout’ or ‘Buy Now’ buttons on your website. Assuming you don’t have a login, users will land on the checkout page in a couple of seconds. Most users will not initiate payment, they will either bounce or go back to browsing.
If you have a login before payment, many of your checkouts will not have a ‘begin_checkout’ row. Your checkout flow needs to take this ‘login’ into account as well.
You can dig into the product side by asking:
how long does it take users to complete a payment?
what is the dropoff at each stage of the payment funnel?
Checkouts_in_session
Then you can zoom out a little to the session level. This is similar to the conversion rate metric marketers use, but we are not interested in CR. Instead we can combine all initiations in a session into one flow, and ask questions.
Questions to consider:
How often do users initiate checkout before bouncing?
How often do users initate checkout before buying?
For returning users, how many sessions and checkout initiations before an actual purchase?
For returning users, how many of them have initiated checkouts and not completed purchase?
what % of these return and complete a purchase in 7 days?
For returning Buyers, how many sessions and checkouts before 2nd, 3rd purchase?
Data model
Enter data model for checkouts_in_session.
Checkouts_user
Let’s zoom out further. Here we are mainly interested in returning users and buyers. We want to focus on two things
sessionwise journey of a user before making a first purchase
journey of a existing buyer between 1st and 2nd purchase
Data model
Enter data model for checkouts_user.
Checkout with emailers/whatsapp
Stores get a significant share of purchases by converting abandoned carts. Often, these cannot be tied back to a users checkout funnel because of data issues. But if you can do this (with some id available in some cases), you have an excellent follow-up to the above data.
what % of checkouts complete via emailers, etc.?
what % of checkouts complete via emailers + discount?
Data model
Enter data model for checkouts_emailers.
Items
The other area of focus in the items being checked out.
For stores with a large selection of SKUs, divided into multiple categories: this analysis can lead to very interesting insights.
First time buyer preference
What do users purchase when they are making first purchase from the website? For stores with a large selection, which categories fill the cart for first time purchasers?
Which items/categories bring users for 2nd purchase, which ones don’t?
checkout flow by categories
How does the checkout funnel vary depending on the items in the cart, the price of the items. How can this lead to more optimised marketing efforts?
removed items
No user journey is complete till some items are removed from cart! In my experience, users bring down the cart value by 30-50% before finally checking out. The items that get kicked out are the ones added on impulse.
Which items or categories are removed from cart most often?
what is the % conversion rate of a category from added to cart to actual purchase?
which items get reduced or increased in cart?
Why ask such questions? For creating bigger or bundled options of products, for rethinking the price of some items, for keeping this in consideration in your marketing efforts, etc.
Items added on checkout
Similar to items getting removed, users also add items. This is true when for small value items which can be added to cart without much thought – like a chocolate protein bar while purchasing protein supplement from a store, or an accessory while buying a formal clothing.
These can also be analysed with the same data.
The complete item funnel.
GA4 provides a particularly powerful view in ecommerce. Items viewed -> purchase.
You can build the same and then make it a lot more useful with paid vs organic comparisons, additional data on prices, data on category of item, separating first time users, returning users, and returning buyers, and so on.
This funnel is among the most important views available in data, and one that can unlock many, many insights if you explore it thoroughly.
Combining purchase data
Frequently purchased together
Identify bundling and upsell opportunities with this short analysis of items that get purchased together. For larger selections, look at categories that get purchased together.
I will skip the part where i tell you how important this event is. You know it already. Conversion Rate, AOV, ROAS, ROI – you know these already. These are the most in-demand metrics in every store – no matter what stage it is in, no matter how different the founders are, no matter what time of day it is!
And all these metrics are based on a single event – ‘Purchase‘
While purchase is one event, the purchase journey comprises many more events. For analytics purpose, the purchase journey starts from checkout initiation and continues till an order is placed. There are many events in this flow, but only 2 that are consistently available on all stores so we will focus on them.
The first of these events is begin_checkout and the last is ‘purchase‘ itself. In between we get events like ‘add_shipping_info’, and ‘add_payment_info’ which can be useful but are not always available. More on this later.
The short journey from checkout to purchase makes up for a good fraction of all product analysis and A/B testing at Shopify Stores. That’s why I will cover these events in great detail – and in 3 separate posts. We will also use the events from previous posts and the models created on them.
In this post, the part 1 of 3 on purchase events, we will look at the purchase events and the base data models that can be built on them.
In part 2, we will use these data models to build more useful models and calculate metrics like conversion, AOV, ROAS, etc.
In part 3, we will use the Shopify Orders table in addition to GA4 data. This data is not available in GA4 but can be extracted from Shopify to Bigquery through some connectors. This will take your analytics to a while other level.
Table of Contents
Events
Event: begin_checkout
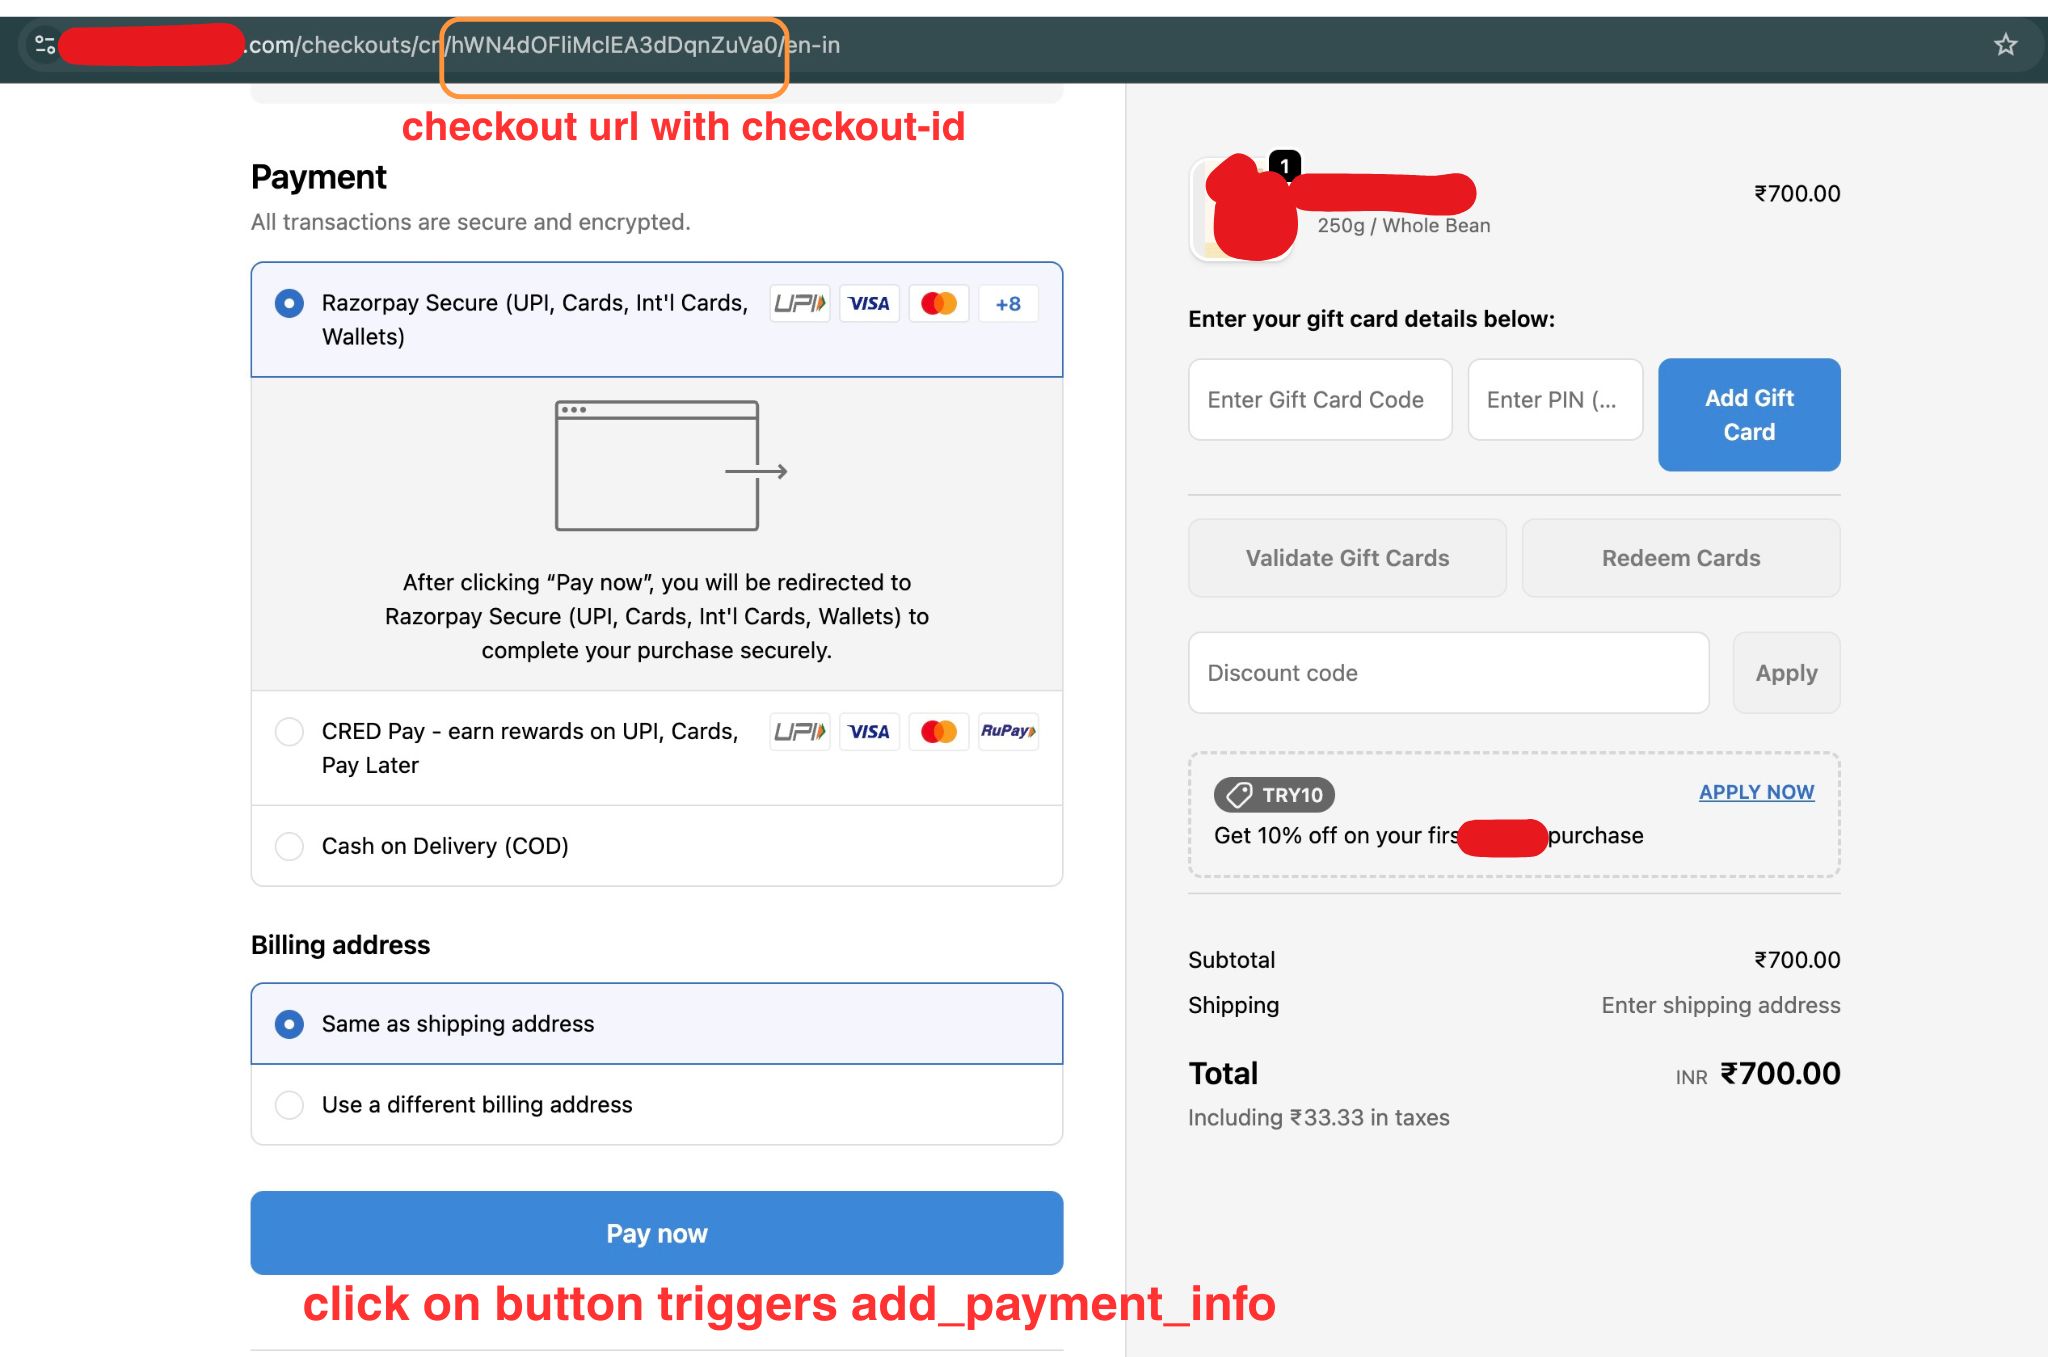
This event is triggered when user lands on the checkout page of the store.
But if your payment is happening on the Shopify payment page, the event is triggered when user lands on the checkout page. In this case the URL has a checkout-id which can be extracted using a regex statement. We can get this URL from page_location parameter of the event.
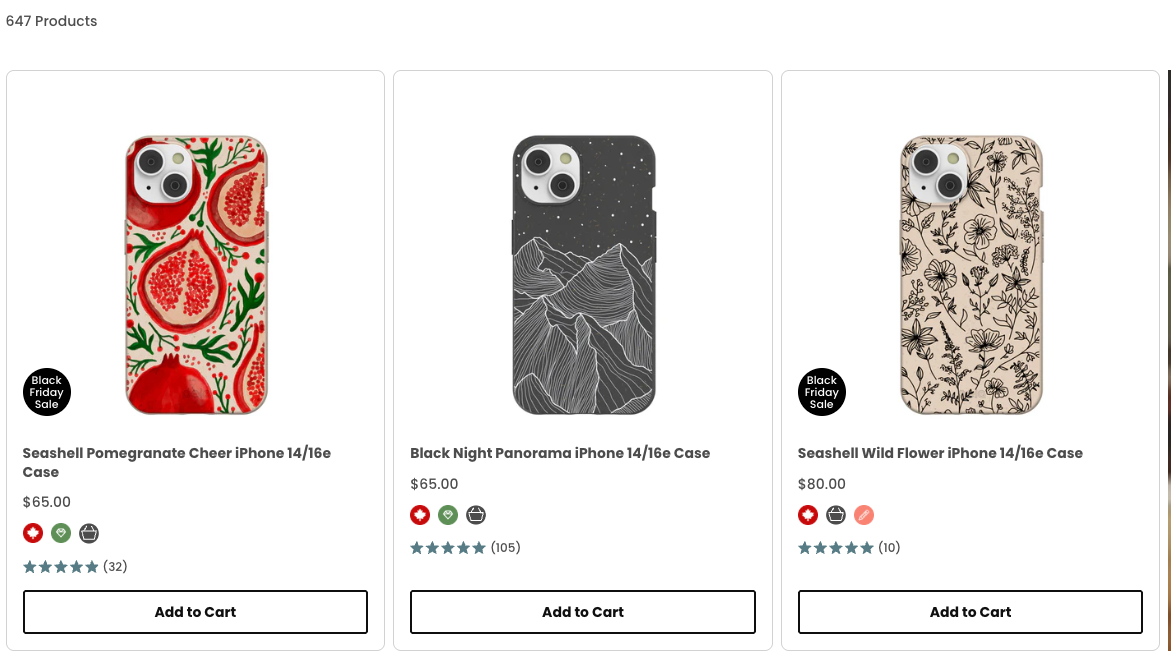
Checkout page on a ecommerce store. Here payment is happening through shopify payment.
This checkout-idis useful in tracking abandoned carts. We will return to this in the next post.
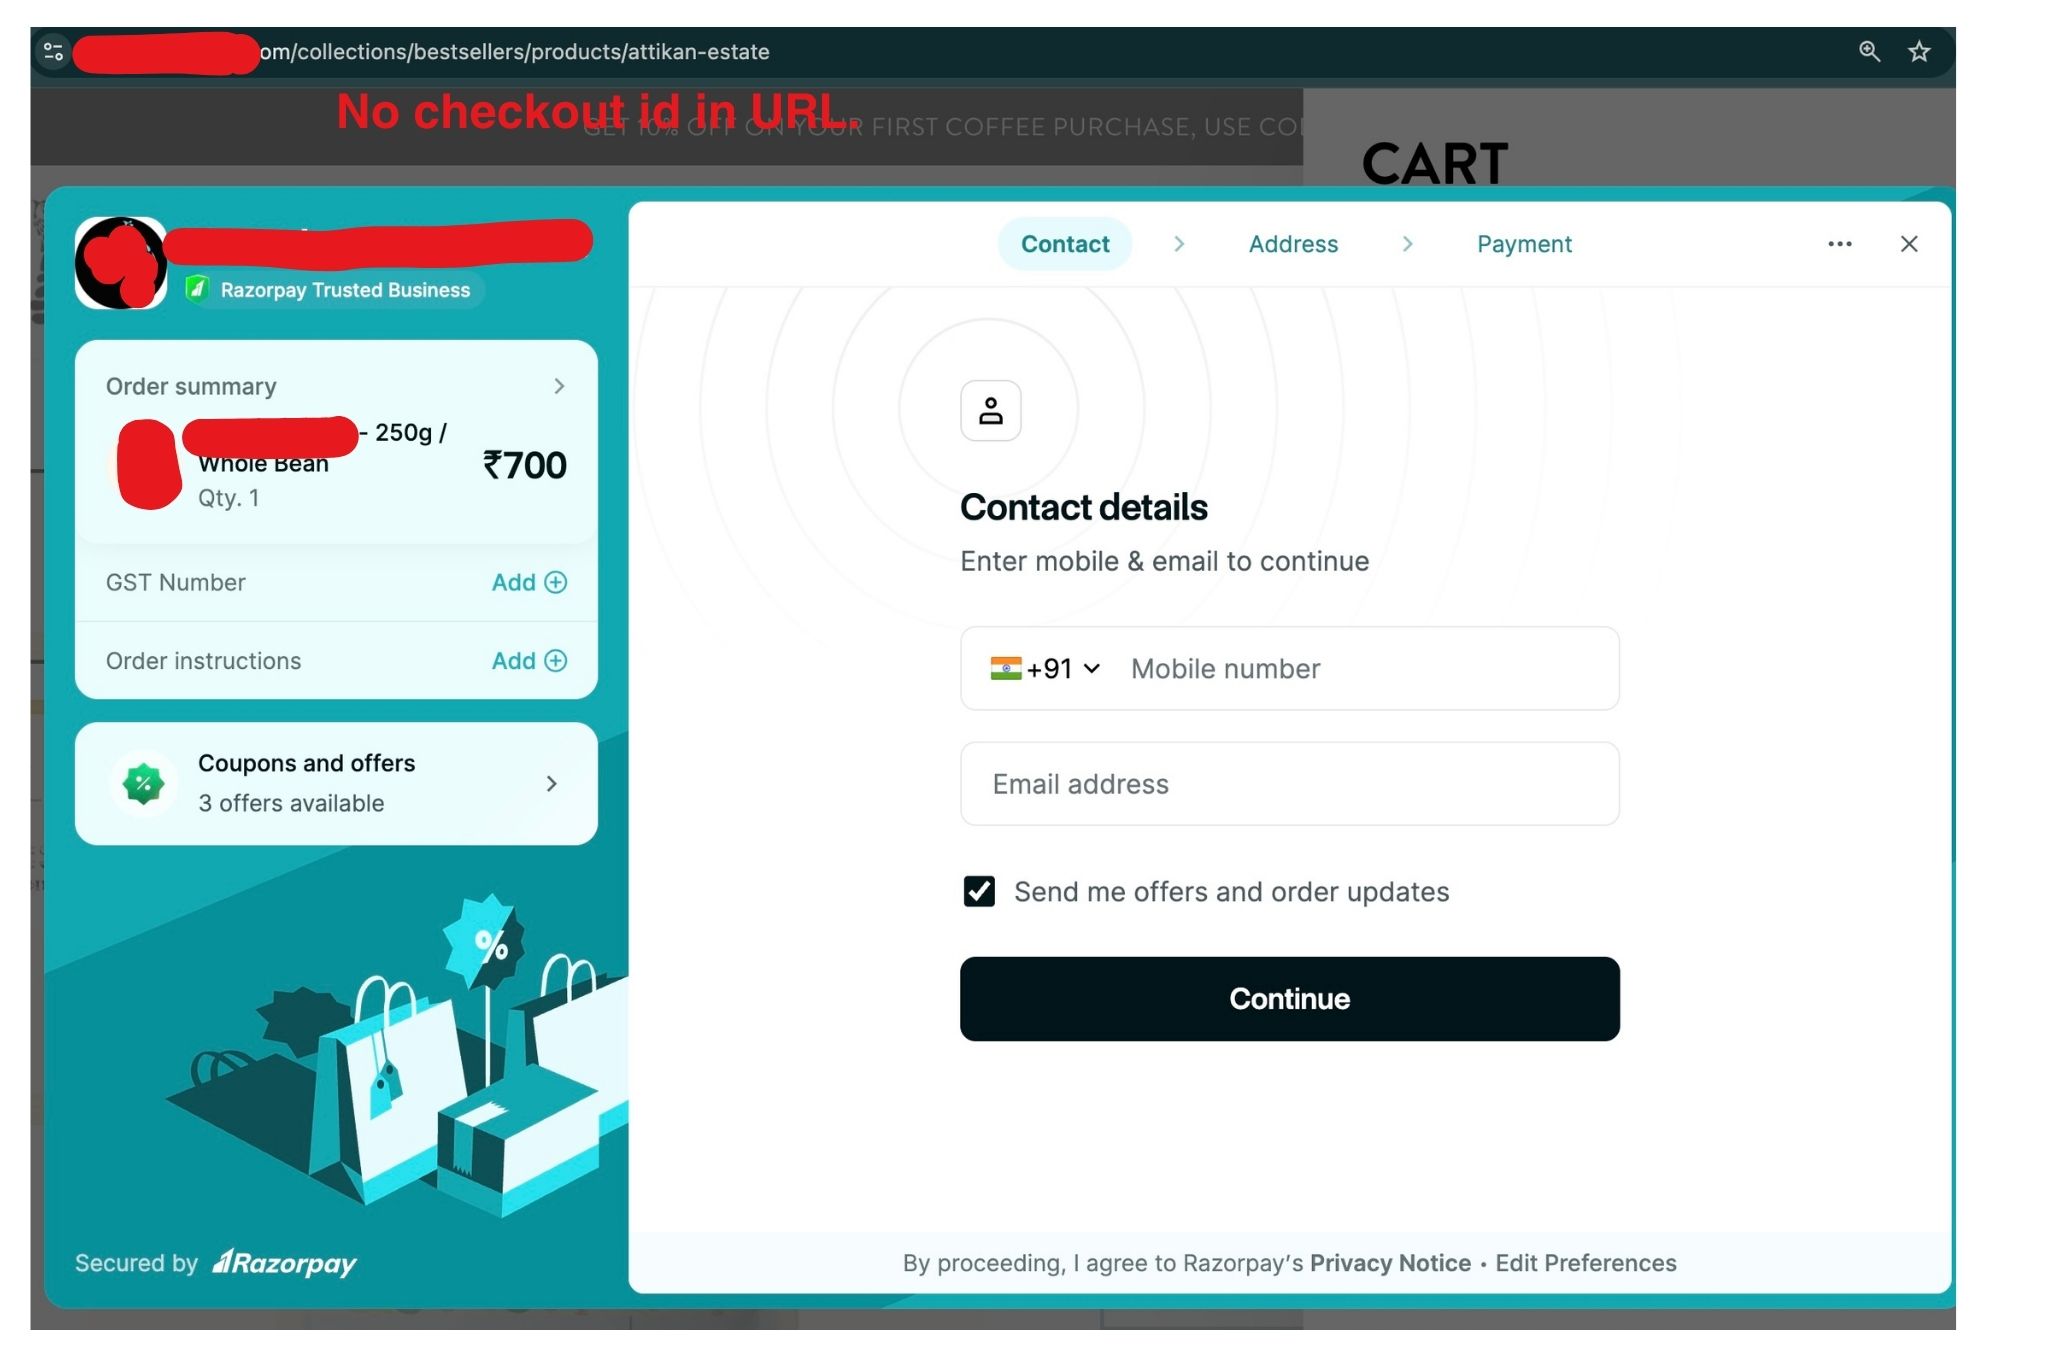
If you are using a payment provider like Gokwik or Razorpay with payments happening on the overlay and not on Shopify payment page, the event will be triggered on overlay.
Apart from checkout-id in URL, begin_checkout also has details about the cart:
Items array with detail of each item in the cart, it’s quantity, and price
E-commerce details : cart items, total cart value
Event value (as will be visible on GA4 dashboards)
In some setups, you also get user’s contact information which can be used to tag returning purchasers.
Event: purchase
The purchase event is triggered after user has completed the purchase and landed on thank-you page.
It contains all the data you get with begin_checkout. In addition, you also get:
transaction_id
final amount paid including discounts and shipping and taxes
payment method (not always available)
coupon and discount (not always available)
tax and shipping value
The event is triggered multiple times if the user refreshes the thank-you page or lands on the thank-you page in the next session. This can cause higher purchase counts in bigquery compared to GA4 or Shopify. However, it’s easy to remove duplicates using the transaction_id or order_id event param from the purchase event.
Event: add_payment_info
This is triggered when user clicks on the ‘Pay’ CTA on the payment page. However, if your payment is happening through ‘Shop’ app or a payment provider like ‘GoKwik’ – the event can be missing.
Before using this event, make sure that it is always available. You can verify this using GTM, or by checking that all the purchases have a ‘add_payment_info’ event as well.
This event contains the same details as begin_checkout. Additionally, you can also get the payment_method and the final payment amount including taxes, shipping and discount.
Event: add_shipping_info
This is triggered when user enters address details in the Shopify address form. It is not triggered if users address is already added. I haven’t found any good use case for this event yet.
Event: page_view
it’s time to look at page_view again. As visitors move from one stage of payment process to the next, we get page_view events in addition to the purchase events.
The URL of page_view event contains some very useful information. Here’s how the URL looks at each stage of a user’s purchase journey
begin checkout – /store_address/checkouts/checkout-id/
payment in progress – /store_address/checkouts/checkout-id/processing/
We use the page_view event in data models to account for missing purchase events. Apart from page_view, we also get session_start, first_visit, etc. This happens when user has landed on checkout page through an abandoned cart emailer or whatsapp message. We handle these in a checkout_remarketing data model in part 2.
Purchase Events in GA4 reports.
In Google Analytics, these events are often marked as ‘key events’. This can be changed from Admin settings in GA4. These key events are used to calculate ‘key event’ and ‘value’ columns in various GA4 reports.
These events are also used for generating some important reports in the ‘Drive Sales’ section of Reports in GA4:
Purchase journey shows user journey from session start to purchase.
Checkout journey focuses on the journey between checkout initiation to purchase
Ecommerce purchases is item focussed table showing views , add to carts and sales for each item
Data models
Read this first!
Purchase related data models can and do go wrong. This is because events are often coming through payment provider and the data quality is just not that great.
If you are using a provider that processes payments outside of Shopify (like Shop, Gokwik, Razorpay, etc.) – confirm what data you are getting in GTM or bigquery, or check with the payment provider for event definition to be sure and then proceed.
Some payment providers (like Gokwik) have their own events to capture the flow. These events are in addition to begin_checkout and purchase events.
these extra events can be used to build a more detailed funnel
good luck figuring out what these mean!
These events flow into almost all reports. So it’s very important to make sure you are getting correct data.
purchase_bi_events
This model is similar to events_all model. But it only contains begin_checkout and purchase event along-with items and e-commerce arrays from the two events. We make this model in addition to the events_all for two reasons:
items array is not used for most of the data models. Thus, we reduce storage and billing by keeping it out of events base table.
We want purchase events as they are to reduce errors. Sharing bad data on purchase is the easiest way to lose credibility as analytics.
order_details
This table contains all the purchase events alongwith parameters from items array, e-commerce, event_parameters, etc. We also add any other detail related to the transaction based on these. Since purchase event is used in many (if not all) analysis, keeping it as a table makes sense.]
Timestamp, in microseconds, when the event triggered
event_counter
A counter to uniquely identify an event occurring more than once at the same timestamp
page_location_og
Page location as it is from the page_location event parameter
page_location
page_location_og after data cleaning.
order_details_itemwise
This has details of all orders placed on the site – at an item level. In other words, we generate one row of data for each item in the order. However, we don’t generate a row for each unit of an item. If there are 5 chocolate bars in an order, we will have one row with quantity = 5. Use this table only for item level analysis. For anything else, refer to order_details table.
Description: This model has all the purchase events on store – at an item level. We extract important details from the purchase event and place it in columns for later use.
Column Name
Description
date_ist
Date of purchase in IST
user_id
unique identifier of the user
ga_session_id
unique session identifier for the user
transaction_id
unique id of the transaction / purchase
checkout_id
checkout_id extracted from URL
event_timestamp
Timestamp, in microseconds, when the event triggered
event_counter
A counter to uniquely identify an event occurring more than once at the same timestamp
page_location_og
Page location as it is from the page_location event parameter
page_location
page_location_og after data cleaning.
quantity
Number of units of the item purchased.
item_variant_id
unique identifier of the item variant
item_name
name of the item, with variant.
item_price
Price per unit of the item.
item_id
unique identifier of the item
total_price
Total price of the item in this order.
checkout_details_itemwise
List of all checkouts started on the website, at an item level.
Important: The count here is higher than ‘begin_checkout’ event. This is to account for cases where we have a purchase event, but no begin_checkout. How can this be?! This can happen sometime in remarketing flows when user clicks on a payment link and lands directly on the payment processing part of the checkout.
Description: This model has data on all the checkout initiated on the store. Here checkout initiation refers to ‘begin_checkout’ event. The checkout data is available at an item variant level for easy querying. For this reason, This contains duplicate entries for each checkout.
Column Name
Description
date_ist
Date of purchase in IST
user_id
unique identifier of the user
ga_session_id
unique session identifier for the user
checkout_id
checkout_id extracted from URL
total_value
Total value of the items in the cart. Do not add this across rows.
remarkting_flag
Flag to identify is user had landed directly on checkout page.
event_timestamp
Timestamp, in microseconds, when the event triggered
event_counter
A counter to uniquely identify an event occurring more than once at the same timestamp
page_location_og
Page location as it is from the page_location event parameter
page_location
page_location_og after data cleaning.
quantity
Number of units of the item checked out.
item_variant_id
unique identifier of the item variant
item_name
name of the item, with variant.
item_price
Price per unit of the item.
item_id
unique identifier of the item
total_price
Total price of the item in this order.
ga_purchase_line_items
This table summarizes the itemwise tables and combines them into one.
As such, it is a single summary of all items checked out and purchased on a day – by session_type and variant_id.
Model: itemwise_purchase_summary
Description: This model summaries checkouts and purchases for each item in a single table. This is to simplify queries. Note that one user initiates multiple checkouts.
Column Name
Description
date_ist
Date of purchase in IST
item_variant_id
unique identifier of the item variant
item_name
name of the item, with variant.
item_price
Price per unit of the item.
item_id
unique identifier of the item
event
purchase / checkout
session_type
paid or organic or abandoned cart message
sessions
number of sessions
users
Number of users
total_quantity
Total units of the item_variant purchased. For checkout – this is taken as maximum units checked out by a user on the day.
total_revenue
Total value of the items purchased. For checkout – this is taken as value of maximum units checked out by a user in an instance.
In the previous post, we looked at user interaction events (user engagement, scroll, video plays, etc.) that allow us to track user’s growing interest in a store. But these events do not contain the metric that we really want to see – add_to_cart.
There’s one more event that does not measure engagement, but has the same structure as ‘add_to_cart’. This is ‘View Item’ event which is triggered when a product page opens. We also get a page_view event for the page, so the view_item is an extra event on page load.
But view_item contains the Items Array – an array with all the information about the product. This is what makes it useful.
These item details are essential data for any analysis. After all visitors want to to buy particular items from your store – so the ‘things’ are important. In this post we will look view_item and add_to_cart events, and get details from Items Array into our models.
The next milestone in user’s purchase journey is adding a product to cart. add_to_cart captures that. Combined, they form the first half a user’s purchase journey.
Items Viewed
Items Added.
The events in part 1 of engagement (user engagement, scroll, video plays, etc.) allow us to track user’s growing interest in a store. Now we convert this interest into numbers and metrics.
Let’s get started.
Events
Event: view_item
Trigger: When visitors visit a product display page (PDP).
Shopify Stores are all about PDPs – users rarely buy an item without going to it’s details page. The view_item event captures just this – product page views. The Items Array gives us all the relevant details about the product viewed.
View_item triggers with the page_view event for PDPs. While the page_view event does not contain any information about the product viewed, view_item contains the Items Array. This is what is contains: –
Items Array
Query for extracting details is WIP.
Name
Description
Availability
Comment
item_name
Name of the item variant as shown on PDP
Full
If your item name changes with variant, this will reflect the same.
item_id
this is the unique identifier of the item. If product has variants, the id has both item id and item variant id.
Full
Multiple variants of an item have same item id but different item variant id.
price
Final sale price of the item as shown to the store visitor. Includes any discount that’s already applied.
Full
quantity
Number of units of the item. Typically the value is 1.
Full
Value depends on the implementation of multi-unit bundles of a product. Use after checking data for your bundle offers.
item_variant
Name of the variant of the item.
This is the text that visitor sees on the product page in the ‘variant selection’ area.
item_category
Category of the item
Only if set in Shopify.
Useful for stores with large collections across various categories.
This items array makes the event useful. GA4 uses this event for all the item level reports it generates by default. It shows up as ‘Items Viewed’ column in E-commerce Purchases report.
Note: if you are selling items in a bundle of 2 or 3, it can be implemented both as a new variant or as a bundle. Check your implementation and event data to figure it out for your setup.
Event: add_to_cart
Trigger: When user adds an item to cart, or increases the quantity of an item already in cart.
The ‘add_to_cart’ event bridges a user journey from engagement to purchase. Ultimately all the engagement should lead the user to add a product to cart.
This event also has an Items Array. This has the same details as give in the table above.
When you start building models with this data, there can be some confusion because of event and parameter names, and also because of events which are not captured by GA4. Below section summarizes the common errors i have faced with the event. (Add your own in the comments section)
Common errors while using add to cart
Users add and remove items continuously in a session. But there is no ‘remove_from_cart’ event, so we only get data about additions. A mistake analysts make it to assume add to carts by a user equal items in her cart. That’s incorrect.
Items added to cart can go out of stock, change in price, etc. before user has checked out. This can happen in the same session or across sessions. We have no way of knowing this till user starts checkout. We can get the items in a users cart in the begin_checkout events. This is covered in ‘begin_checkout’ event in Purchase Part 1 post.
The page_location parameter in add_to_cart event is the URL of the page where visitor added the item to her cart. However, this may not be accurate when the item is getting added from the cart overlay as the URL in this case is the page in the background. You need GTM setup in order to distinguish between these.
If you are using some 3rd party app for up-selling, it may send the event directly to your GA4 account with an arbitrary page location like your homepage’s URL. Or it may not send any event at all. You need to verify the event_params for various cases to be sure.
Note on Items Array and E-commerce Array
The data in these arrays corresponds to the event and the item being added, not to the user’s cart. The quantity value in items array is the quantity added in that instance, not the total quantity of the item. The names of some of these fields can be misleading. Just remember that nothing in these events is related to user’s cart.
We will look into the Ecommerce Array in details in the purchase posts.
Description: This model contains a short summary of product traffic alongwith relevant details about the product page itself taken from view_item event. You can add more columns to improve this summary if you have GTM setup. For example, you can add item_median_rating, pageviews_with_image_clicks, pageviews_with_review_impression, and so on.
Column Name
Description
date_ist
Date, in IST, taken from the event_timestamp
item_id
unique identifier of the product (not the variant)
item_variant_id
unique identifier for the product variant.
session_type
a categorical field based on session source and medium. Data taken from session_details_inc
item_name
Name of the product, typically contains the variant name as well.
item_price_median
median price of the item on this date. Median takes care of small variance in price in a day.
Users
Number of users who visited the product page on the day.
Sessions
Number of sessions with visits to the PDP.
Pageviews
this is a count of page_view events.
Landing_pageviews
Number of Pageviews where the PDP was the landing page.
Pageviews_with_additions
Pageviews where users added this item to cart. We don’t include additions of others items from this page (from the recommended or recent list)
Pageviews where users added this item to cart
Number of users who added the item to cart.
all_atcs
This contains all the add to carts on the page. There are two main types of add to carts:
pdp_atc
add to cart on product display page – for the item corresponding to the product page. Typically these are very prominent buttons and the most frequent way of addition.
This is for add to carts from product cards anywhere on the website – including the cart. This also includes cases of increasing the quantity of an item already in the cart.
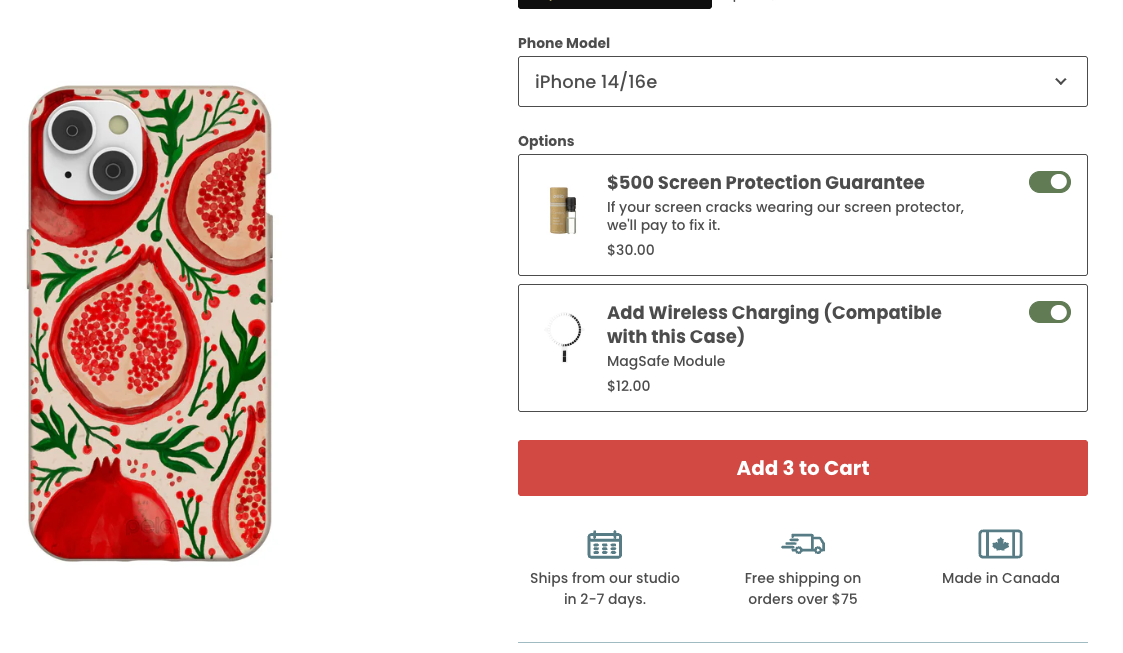
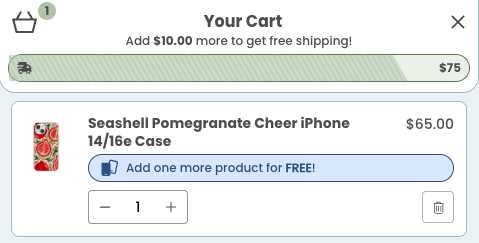
Add to cart from overlay using the + icon. (source pelacase)Add to Carts from Collection Page (source pelacase)
Description: This model contains a short summary of product traffic alongwith relevant details about the product page itself taken from view_item event. You can add more columns to improve this summary if you have GTM setup. For example, you can add item_median_rating, pageviews_with_image_clicks, pageviews_with_review_impression, and so on.
Column Name
Description
date_ist
Date, in IST, taken from the event_timestamp
item_id
unique identifier of the product (not the variant)
item_variant_id
unique identifier for the product variant.
user_id
unique user identifier
ga_session_id
unique session identifier for a visitor
item_name
Name of the product, typically contains the variant name as well.
item_price
median price of the item on this date. Median takes care of small variance in price in a day.
atc_type
product page add to cart, or product card add to cart.
Addition_type
Whether visitors has added a new item or increased quantity of something in cart
page_location
URL from the page, from the add_to_cart event, after removing extra parameters.
With these models in place, we are now ready to dive into engagement data.
What is the best predictor of purchase / subscription for consumer products? In analysis after analysis, i have found the same answer – Engagement.
And it makes sense. Users pay for games that they like playing; they pay for tools that they use regularly; they take subscriptions for services that they find useful during free trial.
For Shopify stores, visitors make a purchase after engaging with your store – reading reviews, exploring collections, loving your brand story. All of this can be measured through engagement.
GA4 Events are bad for tracking engagement
GA4-Shopify integration provides excellent events for measuring visitors, pageviews, the whole purchase journey from add to cart to purchase.
But GA4 does not provide good events for measuring engagement on the site. Let’s see what we get in GA4 –
user_engagement event provides time spent on the website
scroll provides a way to measure users going to the bottom of the page
video_* events provide a way to measure video plays on the website
form_* events provide a way to measure form fills
Apart from user_engagement, other events are impacted by 3rd party apps. For example, an app for adding short videos on the store triggers a video_start event when user clicks on a video, but does not trigger the event if you go from one video to next.
This is not a major issue because you can easily setup engagement events with GTM – Google Tag Manager. You can also add the GTM/GA4 id to some 3rd party apps and get data from them. Here are events you can (and should) measure through GTM:
click events to measure product card clicks, blog and video clicks, menu selections, etc.
click events for variant selection on PDP, for product details, etc.
visibility events to measure if users have seen certain sections like review, FAQs, description, etc.
custom scroll values at multiple thresholds to get a better idea of engagement (default is 90% depth)
3rd party data for searches, video engagement, chatbot engagement etc.
I will cover this in detail in a series on GTM. In this post, I will stick to the default events which do not measure any of the above.
Before you skip this post because you don’t have GTM setup (it is super easy though), let’s look at user_engagement – the single most important engagement event.
Also, the model given in this post will work well with all the additional events whenever you get around to implementing them on your store. So your effort will not be wasted.
Events
Event: user_engagement
Trigger: When visitor has engaged with the store in on the following ways-
visitor has spent over 10 seconds on the store
visitor has done 2 interactions on the site – clicks, form fills, video plays, etc.
user has triggered a ‘key event’ – like add to cart
This event triggers multiple times on a page if visitors stays on the page. This makes it very useful in measuring time-spent by user on a page and in the entire session. (Other analysts have different experience here so do check how it works in your setup).
For stores, this event has one primary use – to calculate engaged sessions and pageviews.
Shopify Stores get majority of visits through marketing and a lot of this traffic does not engage – it bounces. This makes ‘bounced session’ a very important KPI.
Apart from this, the event tracks time spent by user on a page (or on the store during a session). This is because the event triggers every few seconds while a visitor is going over the details of the page – either just scrolling and reading, or clicking on reviews, product description etc.
Note: If you have GTM setup and you track all these small interactions, you don’t need to rely on the user_engagement event alone because each user interaction comes with a engagement_time_msec which contains the time elapsed since last user interaction in milliseconds.
Metrics calculated with user_engagement event –
engaged sessions: a session with user_engagement event is tagged as engaged.
engaged page-views: a page with user_engagement event is tagged as engaged. A session can have multiple engaged page-views.
bounced sessions: a session without user engagement event, and without any other non duplicate page-view is a bounced session.
time on page: total time on page, calculated by adding up ‘engagement_time_msec’ field from ALL the events triggered on a page. Can also be calculated as difference of page load ts of current page and next page, or current page and session end (if current page is last page)
time on site: total time spent by a user in a session, calculated by adding up ‘engagement_time_msec’ field from ALL the events triggered on a page. Can also be calculated as difference of session end and session start timestamp.
In google analytics reports, this event shows up in engaged sessions and average time metrics for page reports.
Event: scroll
Trigger: scroll is triggered when users have scrolled to a specified depth on the website.
Be default GA4 settings, ‘scroll’ only triggers at 90% depth – close to the bottom of the page. This is not very useful. You can trigger scroll event more often by setting it up through GTM.
This event has become less useful because of various reasons – like sticky CTAs at the bottom of the page which trigger the event even when the user is at the top. If you are getting scroll for most of your traffic (even for bounced traffic), it’s clearly buggy. However, if you are getting the event correctly, use it to get a better sense of engagement on your pages.
You can setup visibility events on GTM as an alternative to scrolls. With these, you can directly measure what percentage of users saw a particular section of the page.
view_search_results
Trigger: when users use the search widget on the store.
While the event is useful, it’s easier to get the data from the URL itself using regex statements. If you use a 3rd party app for search, it will give you detailed events for searches.
form_start
Trigger: when users click on a form field.
form_submit
Trigger: when users submit a form.
click
Trigger: when users click on a outbound link – something that takes the user away from the website.
video_start
Trigger: when visitor plays a video on your store.
Use this to measure video plays for videos embedded on your site – on the blog or about pages.
video_complete
Trigger: when visitor watches a video to the end / or brings it to the end.
video_progress
Trigger: multiple times during a video play. Can be used to calculate how long the video was played.
Data of event, in IST. Data model is partitioned on this column.
user_id
unique identifier of the user
ga_session_id
unique session identifier for the user
page_location
URL of the page, cleaned of extra parameters. Referred below as ‘current page’
page_load_ts
timestamp, in microseconds, of page load
Next_page_loc
URL of the next page visited by the user, cleaned of extra parameters
next_page_ts
Timestamp, in microseconds, of next page load
event_counter
counter to uniquely identity events in a session.
trigger_event
Event that triggered the next page load. Only available for GTM based click tracking.
Page_referrer
Page_referrer of the current page
Next_page_referrer
Page_referrer of the next page.
Match_rank
A numeric value corresponding to matching type. This is used for de-duplication. (Refer to query for more details)
Matching_type
Matching Type, assigned on the basis of page referrer values and trigger_event.
Table with details of Matching Type
Matching Type
Description
Event and referrer
The event and the page referrer are aligned and match.
Event only
the event is correct for the page change but the page referrer value doesn’t match. Happens because many events don’t give the correct value for page referrer. Mostly happens with 3rd party events.
Event missing
There is a page change and the page referrer shows the same. But there is no event connecting the pages. Could be because the event is not logged. Or we have not placed a event in GTM to capture this click/link click.
Back button
When user returns to a previous page using the back button.
External link
When user opens two pages from google search / meta ad or links then it’s tagged as external traffic from one to next page.
Referral missing
This happens when next_page_loc does not have a referrer. This implies user entered the URL for the next page and landed on it.
Same previous tab
This implies user opened two tabs from the same tab (like two products from a collection) and then visited those pages one by one.
Checkout flow
When user goes from checkout flow to a page, we don’t get events. Hence they are tagged together into one group.
The below model is just one of many you can build with engagement events. These models only make sense if you have setup additional events through GTM. Otherwise, you won’t be getting much here. You can build similar models for collection page, home page, blogs and any other major page type on your store. Note that the item details are taken from view_item event which we will see in the next post.
Description: This model contains all the events triggered on a PDP. In addition, it contains details about the PDP taken from view_item event. In the query, you can add more fields from event_parameters and items_array to the model below as per your data needs.
URL of the product page, cleaned of extra parameters.
page_load_timestamp
time, in micros, of page load
page_num
page in sequence
event_timestamp
Timestamp, in microseconds, when the event triggered
event
Name of the event
engagement_time_msec
milliseconds since last event
item_variant_id
Unique identifier of the variant of the product
item_product_id
Unique identifier of the product
item_name
Name of the item and variant in a single string (Water, 200 ml)
item_price
Price of the item-variant in Store’s currency
item_category
Category of the item – if assigned.
Next Steps
Compared to the rest of this series, this post is underwhelming, at best. This is perhaps the biggest limitation of GA4 events, and the strongest use case for investing some time into GTM.
However, there is one engagement event we haven’t discussed here – the most important one – add_to_cart. It’s so vital that the next post is entirely dedicated to it.
Page View event is the single most important event in website analytics. Even the ‘purchase’ event pales in comparison to page_view when it comes to use cases.
Page View is used in reports ranging from user acquisition, engagement, user journey, and checkout. In the right hands, this event is enough to build an entire analytics stack.
For example,
You can calculate new sessions and users just from page_view event
you can approximate bounced sessions if there is only one page_view event in a session
you can calculate timespent on a page as time between page_views
you can estimate checkouts from ‘checkout’ page_view and transactions from thank-you page_view
You can also run analysis on landing page, get the best performing product and collection pages, blogs and more from just this single event. At AhaInsights, we rely on page_view event to build our free analysis templates.
But most analysts use page_view event for only one purpose – counting page-views – and even that incorrectly. Let’s fix that.
Trigger
The page_view event is triggered when –
a page loads for the first time
a page reloads for any reason
refresh, variant change, user returned to the tab after a gap of hours
You can get additional page_view events as well if they are configured in the GTM or datalayer. So, there are a lot of duplicate page view events. One of our major tasks at this stage of data modeling is de-duplication of page_view.
But what is page load?
When a potential customer scrolling Instagram clicks on your ad- she is directed to your website. When this happens, three things take place (actually way more than 3 things take place, but 3 for our purposes):
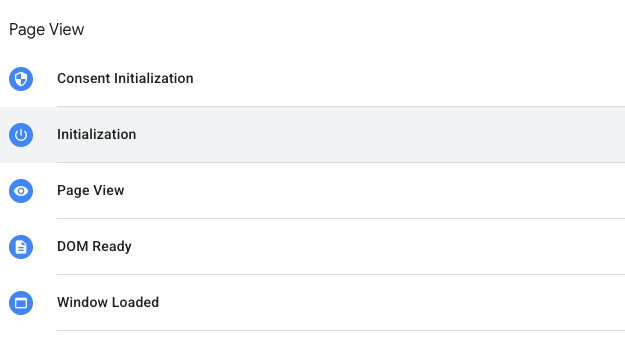
Initialization: First the code for the page is loaded.
DOM Ready: then the structure of page is created on the browser. This is when you see blocks taking shape without content.
Window Loaded : Finally the content loads – all those images, links, scripts that run on the page. This takes the longest.
In GTM (Google Tag Manager), you can setup triggers for each of these stages.
As you can see above, Page_view event is triggered immediately after initialization – way before the page has actually taken shape. Even before this happens!
Most analysts are not aware of this and treat page_view event as an actual page view from the user. But it’s not the case – specially if your users have slow internet speed, or you have a slow loading website because of high definition images, or multiple 3rd party integrations.
This is important. Most Shopify stores are not optimised for page load times. That’s partly because of the highly visual nature of e-commerce, and partly because of a lack of technical ability. If your site takes too long to load, many users will bounce before the page even loads.
Your slow loading pages will have higher bounce rates compared to faster loading pages because users don’t have a lot of patience nowadays.
User journey and page_view
Before we get into the specifics of the event, let’s understand how majority of users interact with a website. This will guide our data modeling choices.
For Shopify stores:
majority of sessions start through Instagram and YouTube mobile apps
sessions are short and include small number of page views
users spend few seconds to couple of minutes on a page before moving to the next page
As majority of sessions are on mobile, users typically have only one tab open at a time. They go back and forth (For example – from collection page to product, then back to collection and then to another product, and so on).
Because of this simple linear journey – We can take the sequence of page_view events in a session as a continuous user journey on the website – because user can only be on one tab, and also because the whole thing is a few minutes long.
This means we can use page_view events to get –
timespent on a page
pages visited next on the website
mode of navigating between pages.
Interpreting page_view events
In a typical user journey, page_view is triggered multiple times. Here’s what it means:
the first instance of page_view means – a user has landed on a page on the store.
The next instance of page_view means – the user has engaged with the store (as opposed to bouncing off).
The sequence of page_views in a session show the user’s journey on the website – products seen, pages visited, checkouts started or not started, etc.
Event Params in page_view
I discuss event parameters in detail in the next post. For now, let’s just look at the key identifiers in page_view events:
page title: title of the page – as shown in the browser
page_referrer: tells you where the user has come from.
page_location: the URL of the page
ga_session_id
Of these, page_referrer is the least used in analytics (Even GA4 barely uses it). I have found it to the one of the most useful fields.
page_referrer parameter
Page_referrer is the URL of the page which referred the user to the current page. Mostly, it’s just the previous page in user journey. For Shopify stores in particular, page referrer helps understand how users are navigating between pages. We can find
if users are heavily relying on back button (this means your website needs better navigation)
if users are opening multiple tabs from collection / home page – and which ones?
if user has opened multiple links to your store from google search results or Instagram ads in the same session
There’s one important edge case though. This happens when user clicks on the back button( or swipes back on mobile). In such cases, the page referrer still shows the original referrer of the page. For example, consider this journey:
user lands on home page of ‘bluetees.com’ store from instagram ad (page_referrer = “instagram”)
user clicks on a collection ‘Very Blue’ and lands on collection page (page_referrer = “bluetees.com” – the homepage URL)
user goes back to home page with back button / swipe on mobile (page_referrer = instagram, not the collection.)
This happens because ‘Back’ button reloads the page from memory in the browser, so the data remains unchanged.
This is important if you want to control how users move about on your store. Otherwise, you don’t really need to worry about it.
Data models
While page_view is essential for analytics, we can’t use the event in it’s ‘raw’ form because the data from this event needs a lot of cleaning and prep.
There are 3 major issues with page_view events:
Messy event params
page_location and page_referrer values often contain a lot more information apart from the URL. This includes –
section of a page (#reviews, #bundle-1, etc.)
variant of a product (?variant_id =)
utm details (source details)
and more.
We use page_location for a number of analysis and models, and having all this extra information makes it difficult to group on page location. Luckily for us, the extra information is always preceded by a “?”. So we can use regex to get the part of page_location before the “?” symbol.
As a special case, we add back the variant_id. That’s because variant views are important indicators of user engagement for Shopify Stores. This is handled in the ‘all_pages’ data model below.
Duplicate events
In most data setups, you will get multiple page_view events triggering on the same page. This could be due to page reload, more than one method of GA4 integration, web pixel events, etc. Even if it’s not happening now, it will happen as your store grows and becomes more complex. so it’s must to have logic for de-duplication in the queries.
De-duplication
We can remove duplicates after cleaning up the page_location.
But what exactly is a duplicate page_view? A visitor can go the same page multiple times in a session. That’s a good thing. If a visitor is going to a PDP multiple times, it means a higher intent to buy. So we want to count it as multiple pageviews.
But what about the event getting triggered multiple times when the user is just scrolling or clicking on links within the page (like #reviews, #backtotop, etc.). In this case, we still get ‘page_view’ event but we don’t want to count this as a separate view. We remove these pageviews. They also form the majority of views in our data.
We handle this in ‘unique_pages’ data models below.
Note – GA4 does not de-duplicate data and so you often get inflated Views count in the dashboard. However, Unique Pageviews (equivalent to Sessions for a page) matches closely with the cleaned data.
Missing events
After cleaning the duplicates, it’s time to add some page_view events of our own!
On desktop, users often have multiple tabs open and they go from one tab to other and back. Users can also do this on mobile but it’s mostly a desktop behavior. The page_view event is not triggered for such page switches. But we get other events like click, scroll, user_engagement, etc..
Without that first page_view, it becomes difficult to use the engagement events. So, We add dummy events to account for these tab switches.
This is handled in the all_events data model.
Base data models
We can build three models to achieve the above:
all_pages
all_events
unique_pages
As you will see in subsequent posts, these models connect the initiation models (sessions and users) with engagement models (transactions, engagement, etc.) to create a full view of user journey.
Our primary objective here is to cleanup the data for messy URLs and duplicates, and add dummy data where needed to complete the user’s journey.
Additionally, we also build the all_events model in this step to handle cases with missing page_view event.
Note – This is just one way of handling these issues. I have landed on this after several iterations and it seems to create the least number of problems.
Model : all_pages
In this model, we focus on URL cleanup. We take page information from all the events – not just page_view. This is to reduce one step the all_events model below.
Description: In the all_pages model, we extract and prepare the page_location parameter from all the events. This parameter is central to all analytics but it is not directly useful in the way it appears in GA4. So we clean up the data by removing all the extra parameters (after the ?) and flag cases which may not be reliable (3rd party data), and add a page_number counter.
Column Name
Description
unique_key
user_id + ga_session_id + event_timestamp
user_id
unique identifier of the user
ga_session_id
unique session identifier for the user
page_load_timestamp
time, in micros, when the page loaded
page_exit_timestamp
time, in micros, when user left the page or the website.
page_num
page in sequence
event_name
Name of the event
event_timestamp
Timestamp, in microseconds, when the event triggered
event_counter
A counter to uniquely identify an event occurring more than once at the same timestamp
page_location_og
Page location as it is from the page_location event parameter
page_location
page_location_og after data cleaning. We remove everything after ‘?’ in URL except the variant id.
product_id
Unique identifier of the product, only available for product pages.
variant_id
Unique identifier of the product variant, only available for product pages.
Model : all_events
Description: All GA4 events have page_location in the event_parameters. We want to know where a event happened which is easy to do with the page_location. Or, is it?!
Let’s consider this common use case –
user lands on the “blue striped cotton shirt” product page through an ad
user clicks on some buttons – product information, size options, etc.
user clicks on ‘dark blue cotton tee’ product card and goes to another page.
After some time, user is back on ‘black striped cotton shirt’ page and clicks on ‘add_to_cart’
Now, we know the key event of add_to_cart happened on the ‘black striped cotton shirt’ PDP page. But it happened on the second instance of the page. If we ignore this idea of instance, our calculations for ‘time between event and page load’ will be off.
We will also miss a significant part of the user journey – that the user looked at other products and pages before making this choice.
So, we want to map the event to an instance of the page load within the session, not to the first page load.
Model: all_events
Description: This model contains all the events that are in raw data with some event parameters extracted for ease of writing subsequent queries.
Column Name
Description
unique_key
user_id + ga_session_id + event_counter
date_tz
Date, when event triggered, in time zone of store.
time_tz
Time when event triggered, in time zone of the store.
user_id
unique identifier of the user
ga_session_id
unique session identifier for the user
event
Name of the event
event_params
Event Params array from the event
action_event
Flag to separate user triggered event (clicks, form fills, etc.) from store events like page_view, view_cart which do not imply user action. Useful with GTM.
page_load_timestamp
time, in micros, when the page loaded
unique_page_id
unique identifier of the page.
event_timestamp
Timestamp, in microseconds, when the event triggered
event_counter
A counter to uniquely identify an event occurring more than once at the same timestamp
page_location
Page location, cleaned, after data cleaning.
Model: unique_pages
The first two models – all_pages and all_events do all the heavy lifting for cleaning up the data of page_view event. unique_pages removes the duplicates, combines data together, and gives us a step-by-step picture of the user journey.
Model: unique_pages
Description: This table contains unique pageviews from all_pages_inc. It combines all instances where user has page view or dummy page view event on the same page in succession (this can happen due to variant selection, bundle selection, blog section selection, etc. ).
Column Name
Description
unique_key
user_id + ga_session_id + event_timestamp
user_id
unique identifier of the user
ga_session_id
unique session identifier for the user
page_load_timestamp
time, in micros, when the page loaded
page_exit_timestamp
time, in micros, when user left the page or the website (in case of last page)
page_num
a counter for pages visited by user in a session
page_location_og
Page location as it is from the page_location event parameter
page_location
page_location_og after data cleaning.
page_type
Page Category
page_referrer
Page referrer of the page, from the first page view event.
product_id
for product pages only, unique id of the product.
variant_id
for product pages only, unique id of the product variant.
next_page_loc
URL of the next page visited by user on the site (null if no next page)
next_page_timestamp
Timestamp, in micros, of next page load (null if no next page)
next_page_referrer
Page Referrer value of the next page
timespent on page
Total timespent, in seconds, on this page
landing_page
flag to identify the landing page of a session
Next Steps
Many data analysts do not build these models – taking the data from page_view as it is. This is one of the biggest reasons behind data mismatches.
These also give you great idea on how GA4 collects data – particularly for the edge cases. Handling these edge cases is essential for building trust in data team. That’s how you showcase that you really know what you are talking about.
Now we are largely done with the ‘data prep’ stage of data models. We have users, sessions, page views, and events. In the next section, we will look at Event Parameters in depth and then we will be fully equipped to build useful models.
GA4 events are powerful because each event contains a wealth of information in the form of event parameters, item details, device, geo and source details, and more! Working with these parameters makes queries shorter, more robust and more detailed.
When you first begin to work with this data in bigquery – it can be overwhelming and very confusing at first.
The definitions are not always clear,
edge cases keep showing up,
and documentation is poor.
But understanding them is worth the pain because they provide so much detail about the event. I have learned this over multiple projects, and after making my share of mistakes. It took me a couple of years to fully appreciate just how much information is available in all the events and also to figure out what it means.
Each event has 100+ fields containing data about the user, website, device, first and current source, and what’s inside users cart. If you want to get value from these events, you have to understand the available data and how to extract it correctly. In this post, i want to cover the basics of these parameters and leave you with more appreciation and curiosity for them.
In addition to the details provided by GA4, we often 100 or more extra parameters on top through GTM and datalayer. All of this added information appears in event parameters of the additional events we trigger. I will cover this in details in another series.
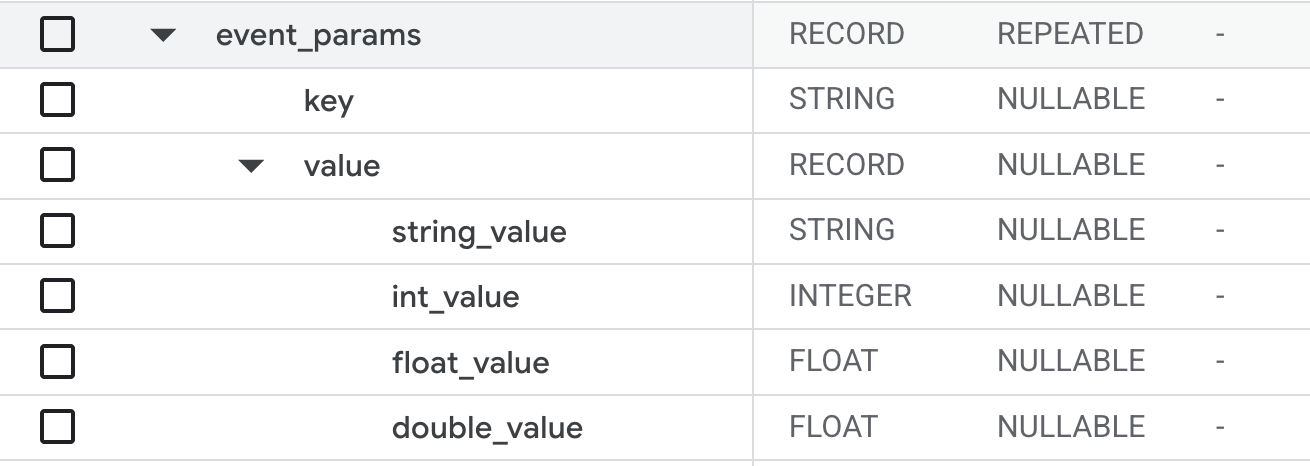
Structure of event param array.
This is an array inside the event. You can think of it as a table inside another – a nested table. GA4 uses this structure to store large amount of information in each event. In the past, we had to define a separate column for each value and track the value stored in a documentation. Now it’s all available in event_params.
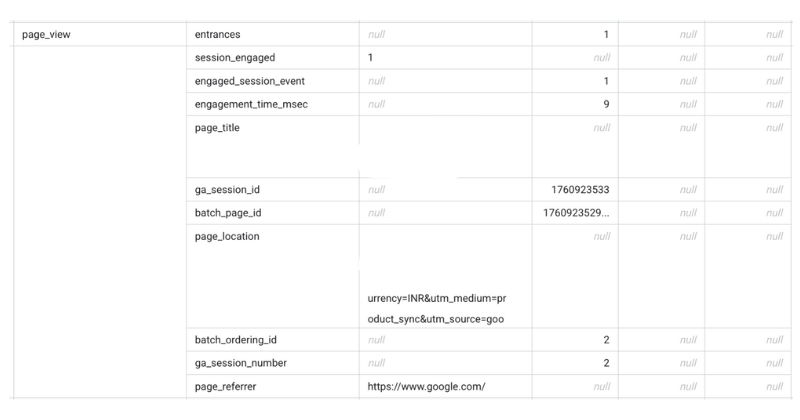
Preview of the page_view event event_params record:
The first challenge for many analysts is – how do you even get the data out from this nested field? When this first launched, i found it very confusing. There are many different ways of doing this. However, i recommend the query below.
SELECT
  user_psuedo_id,
  event_timestamp,
  event_name,
  (
  SELECT
    MAX(COALESCE(value.int_value, value.double_value, value.float_value))
  FROM
    UNNEST(event_params) params
  WHERE
    params.key = 'ga_session_id') AS ga_session_id
FROM
  table_name
Note that there is no “group by” statement in the outer query. This is to handle cases where multiple instances of an event get logged at the same time. This can happen due to batching. The correlated subquery lets you get the data without aggregation.
A note on query efficiency
You will notice that data models from ga4dataform, velir and my own – extract most of this data in the base layers and don’t carry the event-params field into subsequent data models.
This is because event-params significantly increase the table size and query length and billing. To keep things cleaner and simpler, we extract the values in one go. Typically we do this in ‘all_events’ data model covered in previous post.
Definition of event parameters
Each event contains 10 odd key value pairs in the event_parameters array. There are no null values in this array. If a value is not available, you will not see the key corresponding to it in the array.
Page Related Parameters
page_title
event_params.value.str_value. Useful for debugging. This contains the title of the page as visible to the visitor in their browser. Useful for identifying product names, collection names, blog names etc. if you are not using GTM-datalayer to store these values separately.
page_location:
event_params.value.str_value. Page Location is the URL of the page. That sounds trivial but the URL is full of information which can be extracted using regex statements:
If the user is on a section of the page, you will get the section id after a # symbol.
If it’s the landing page, page location will have parameters appended to the URL (typically after a question mark symbol “?” ). You can use regex to extract these params as needed.
You can also use the URL to get collection name, collection page, search query, product name, blog page, stage of checkout process and more. Pay attention to the extra parameters in the URL at various stages to understand what is available.
page_path:
this is similar to page_location, but it does not contain the hostname. It contains only the path of the page within the website. Useful if you are writing query that’s applicable to many websites.
page_referrer:
Referrer contains the URL of the page from where user initiated the current page. For example, if user has clicked on an ad on instagram, the page_referrer would be ‘instagram.com’ If the user has clicked on a link in whatsapp, the referrer would be ‘whatsapp’ If user has clicked on a link home page and landed on a product page, page_referrer will be the URL of the homepage and so on. It is empty (null) if user entered the URL into a address bar and arrived (how rare is that!).
page_referrer values are useful to understand how user is landing on a particular page in your website. For example, if users are landing on a product page through homepage but not through any collection, it could be missing from collections. If user has several ‘instagram’ page_referrer values in a session, it means user is interacting with multiple ads on instagram in quick succession. If user has ‘google’ multiple times in a session, it means user searched for something and is opening multiple links to your website.
ignore_referrer:
This is a field set through GA4 settings. This tells google analytics to ignore the referrer from ‘Referral’ source of traffic. This can be set from GA4 admin settings.
Metadata
These events are only useful in debugging queries and event logs. They contain information about when the event got logged. So they don’t reflect user behavior in any way.
batch_ordering_id
Although the events are triggered sequentially on the website, they are not continuously streamed to GA4. Events are batched and uploaded to bigquery.
batch_page_id
This param assigns a unique, sequential number to each page a user visits within an engagement. Typically each batch contains events from a single page so the value of batch_page_id is usually 1.
batch_event_index
(from Google’s documentation) A number indicating the sequential order of each event within a batch based on their order of occurrence on the device.
stream_id
Not available as event parameter, but as a column. This is the stream id of the data source – as it is setup on GA4 account. Useful if you have multiple streams of data for a website. This is possible if you have data from multiple domains flowing into one GA4 account.
data_platform
Refers to the platform of the data stream. Could be (Web, IOS or Android).
Unique identifier of the session. Covered in more detail in initiation events.
ga_session_number:
User’s session count on the website. As user tracking is not reliable, this is not useful.
engaged_session_event
Number of engaged sessions of the user. As user tracking is not reliable, this is not useful.
Engagement related
engagement_time_msec
time between previous event and this event. This is available if the event is triggered by a user action, and not available if the event is automatic. Note that this is the time between previous logged event with user_engagement_msec field and the current event. If you sum up user_engagement_msec across all events on a page, you get the total time on page.
session_engaged:
a flag (0/1 ) indicating if it’s a engaged session. GA4 defines engaged session as 10 seconds, 2 clicks, or 1 key event.
Shopify Specific:
These params are available only for Shopify stores (and some other ecomm stores) and only for a small number of events. List of events – view_item, add_to_cart, begin_checkout, add_payment_info, add_shipping_info, purchase.
ecomm_totalvalue
This is the value of the event as it will reflect in GA4s value field.
add_to_cart, view_item – this is the price per unit of the item being seen or added to cart.
purchase events – this is the total value of the cart.
ecomm_pagetype
This refers to the type of the page where the event is triggered – home, product, collection, etc. If you use a 3rd party checkout that works as an overlay, the pagetype value of purchase events refers to the page in the background. This could be misleading.
ecomm_prodid
This is the unique identifier of the product and variant. This is generally stored as a string which concatenates the string ‘shopify’ with ‘product_id’ and ‘variant_id’.
You can use a regex statement to get the two ids from the field. Variant_id is more useful of the two as it is available in shopify orders table as well as item_id in Item details (covered below)
UTM Source and related fields
You can find upto 4 different values of session source in a bigquery event. But you will mostly find just 1. Let’s explore these.
utm_parameters in event parameters. These are read from the URL. You may have even more details in the URL itself.
collected_traffic_source: this also refers to the paremeters collected from the URL itself.
session_traffic_source_last_click: contains the last-click attributed session traffic source data across Google ads and manual contexts, where available.
traffic_source: contains information about the traffic source that first acquired the user. This record is not populated in intraday tables.
Very confusing, i know. If you are doing a session level analysis and want to find the source of the channel (source, medium, campaign, etc. etc.) – use the collected_traffic_source field from the very first event in the session – typically this would be session_start.
If you are doing an analysis on user, you want to know where the user came from when they were acquired – their first visit to your store. In this case, use traffic_source.
It is possible for a user to click on multiple ads of your store in the same session. You will get page_view event when the user lands and the collected_traffic_source of the event will have the details of the ad on which the user clicked.
If you are using data models available on AhaInsights, you don’t have to worry about any of this. We make sure you have the correctly scoped utm details in the models.
Device and Geo details
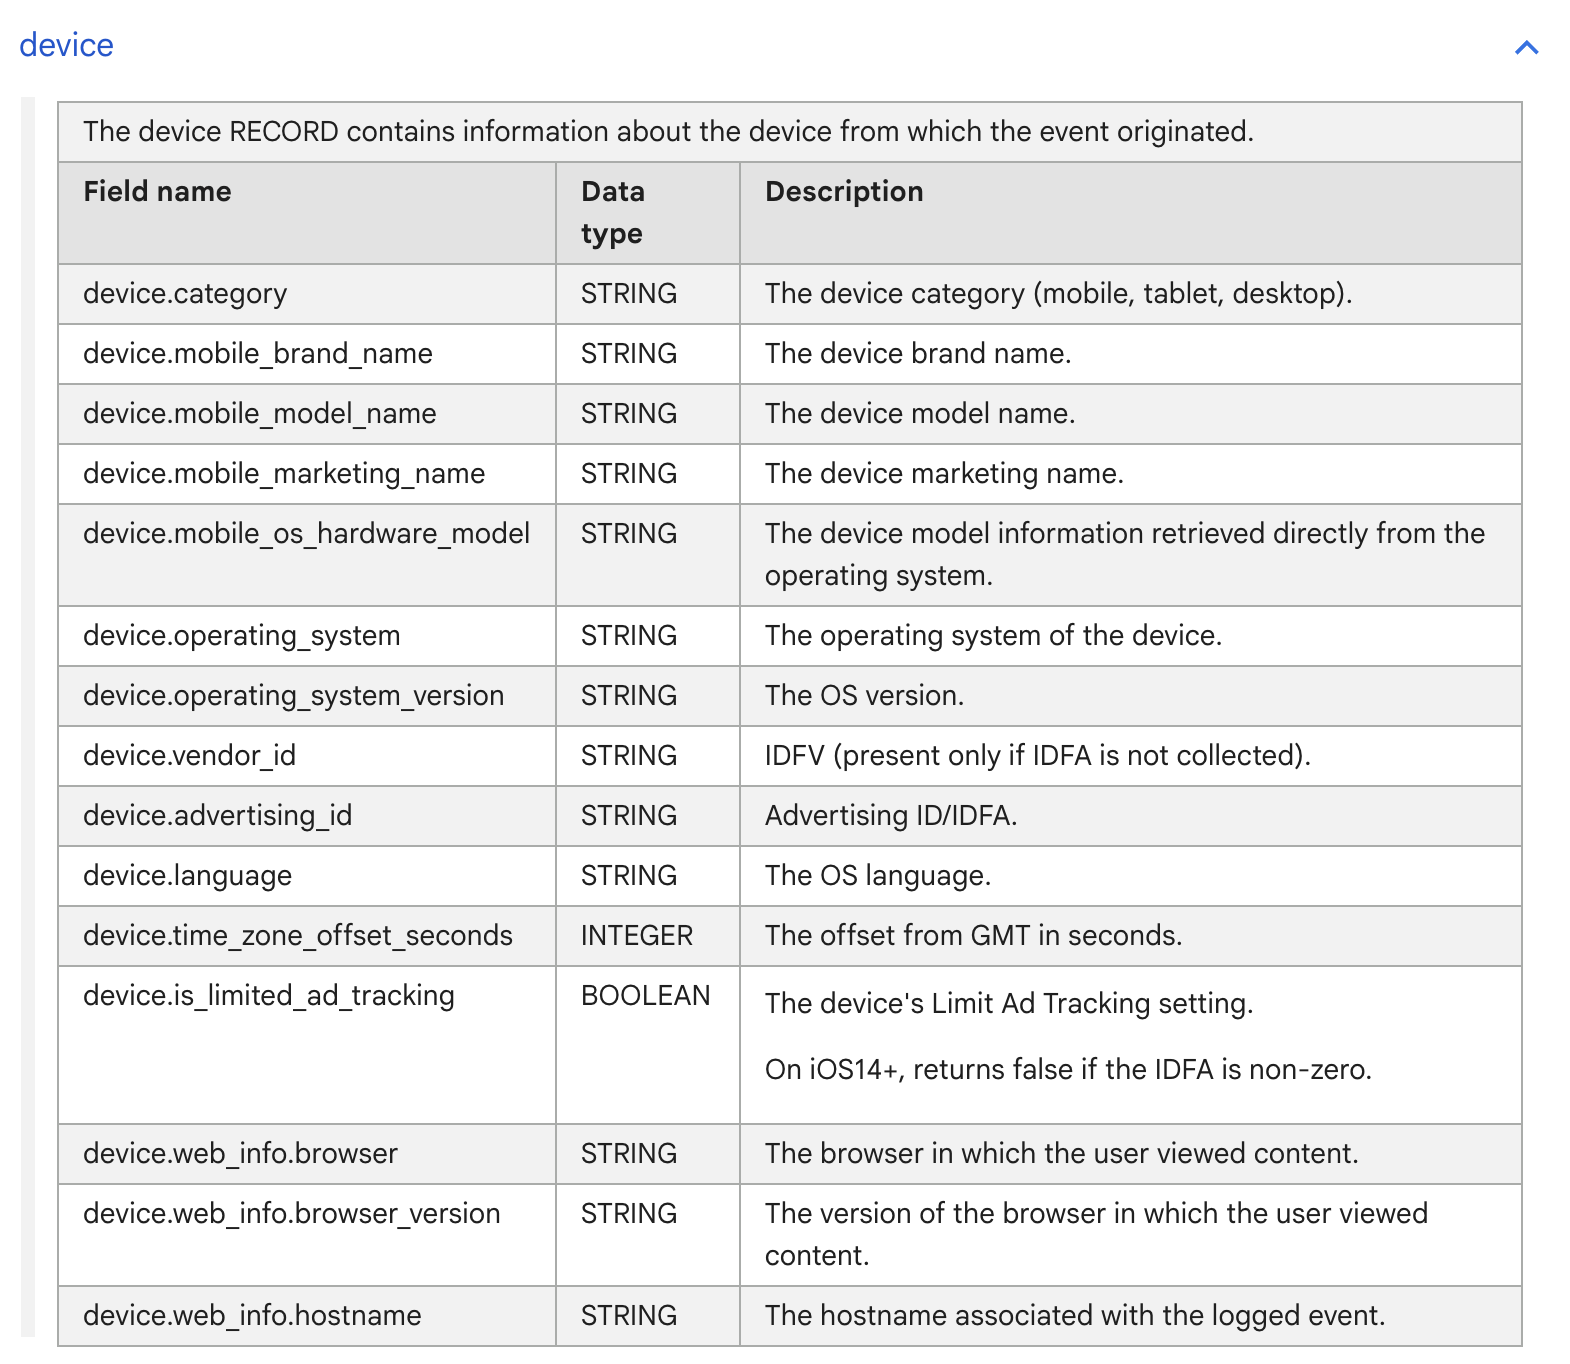
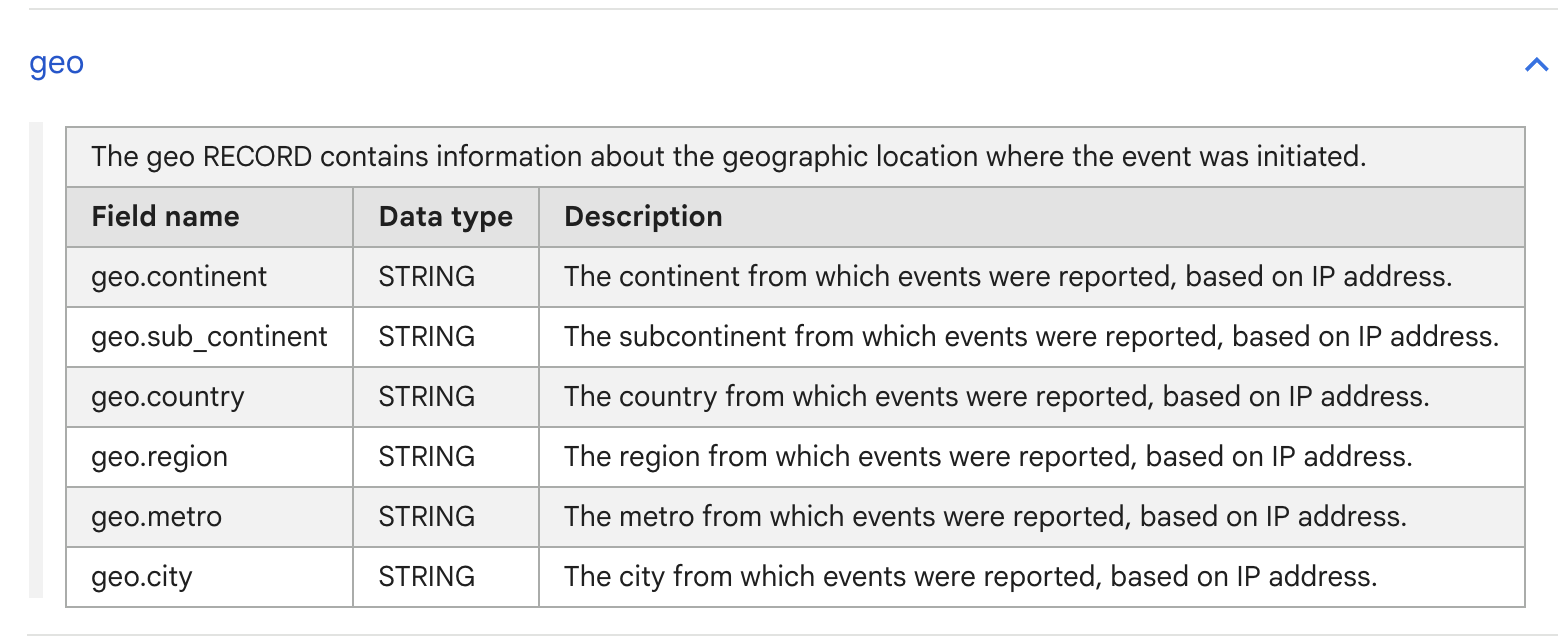
All events contain details of the user’s device and location. I have shared screenshot from Google’s documentation below as the description is obvious and does not need any explanations.
In the device record, Only two fields – device category and operating system – are useful for analysis. Other fields are useful for occasional debugging or user profiling. Many of these fields are related to mobile apps and will be null in your data.
We also get detailed information about the user’s location in the geo record. This is useful for reporting and profiling users as coming from tier 1 / 2 etc. Also helpful in analysing the impact of localised or offline campaigns, RCAs for bad traffic, fraud detection, etc.
Item Details
Thanks to GA4-Shopify integration, we get all the item details in the most important events. These are essential for building data models for shopify stores. Of these, item_id, item_name, item_price are always available and most useful. I will cover these in detail in the engagement and purchase events.
Items Array
Query to extract details: link to the query, link to query 2.
Name
Description
Availability
Comment
item_name
Name of the item variant as shown on PDP
Full
If your item name changes with variant, this will reflect the same.
item_id
this is the unique identifier of the item. If product has variants, the id has both item id and item variant id.
Full
Multiple variants of an item have same item id but different item variant id.
price
Final sale price of the item as shown to the store visitor. Includes any discount that’s already applied.
Full
quantity
Number of units of the item. Typically the value is 1.
Full
Value depends on the implementation of multi-unit bundles of a product. Use after checking data for your bundle offers.
item_variant
Name of the variant of the item.
This is the text that visitor sees on the product page in the ‘variant selection’ area.
item_category
Category of the item
Only if set in Shopify.
Useful for stores with large collections across various categories.
Similar to Items record, we get an ecommerce record with each event. It contains useful information about the cart at the time of the event. Of these, item_quantity, purchase_revenue, transaction_id are most useful. I will cover these in detail in the engagement and purchase events.
Ecommerce Array
Query to extract details: link to the query, link to query 2.
Name
Description
Availability
Comment
total_item_quantity
Number of items in the cart.
Full
If there are 5 units of a item, it will be counted as 5.
purchase_revenue_in_usd
Revenue in USD.
Full
purchase_revenue
Revenue in store currency
Full
refund_value_in_usd
Refund value in USD
Partial or None.
refund_value
Refund value in store currency
Partial or None.
shipping_value_in_usd
Amount paid for shipping, in USD
Availability and quality depends on the data provider
shipping_value
Amount paid for shipping, in store currency
Availability and quality depends on the data provider
tax_value_in_usd
Tax paid on the order, in USD
Availability and quality depends on the data provider
tax_value
Tax paid on the order, in store currency
Availability and quality depends on the data provider
This post was a short introduction to the rich data available with GA4 events once you get them into Bigquery.
As i mentioned in the beginning of this post, this can be a lot to remember / use in your work right away. But this is where you will unlock the most value from data.
Most reports and analysis start with two questions about the users:
How did visitors land on the website?
Where did visitors land on the website?
How and Where a visitor lands on your store decides what she will do in the next few minutes.
Additionally, we also want to know if a visitor is visiting the store for the first time, or if she is a ‘returning’ visitor. As we will see in this post, we cannot rely on this classification but we can still use it to get some insights.
These details form the identity of a visitor. We treat these details as user attributes – because this is the best information we have about any visitor in the privacy era. For instance, here is a short list of visitors to a t-shirt store:
new , from Instagram campaign id xyz_1, landed on black t shirt PDP
new, from organic search, landed on t-shirts collection
returning, direct visit, landed on home page
returning, from YouTube campaign xyz_2, landed on white t shirt product display page
returning, from email, landed on checkout
new, from email, landed on checkout.
Since this information is used almost everywhere, we will start out data modeling journey with the two events that contain all these details (and more) – first_visit and session_start.
The misunderstood events
Many shopify founders are under the false impression that users have to be converted in every session possible. CRO experts and marketing agencies have created this impression mainly to serve their own goals.
But who makes a purchase from a new brand in the first visit? Very few buyers are that impulsive. Visitors typically make multiple visits to a store before making a purchase – in addition to checking socials, asking on reddit, etc. This is why it’s important to separate first time visitors from returning visitors.
But, due to reasons explained later in this post, we cannot track most of our returning visitors. Most of them will get tagged as new in every visit.
This is the biggest issue with data setups in the privacy era, and there’s very little we can do at the data collection stage.
However, this is where you get to differentiate yourself from most analysts. If you understand how this data is collected by GA4 – you will be able to handle stakeholder questions about new/returning with ease. You will also get better at finding insights from the data.
The majority of this post is dedicated to build your understanding of data collection in the privacy era. This will make all the difference in your data setup.
We will start with a quick look at events and then get into the data collection process, issues in privacy era, and what we can do to handle these issues
Events
Event: first_visit
Trigger: when a new user lands on the website.
The first_visit event is triggered on a user’s first visit to the store. But who decides if it is a first visit – is it shopify, your store, or GA4? Since, all these events are created by GA4 based on what it knows / does not know about your store – the decision is also taken by GA4.
In our data models, we use first_visit event to identify if this is a new user (as per GA4), and get the following details:
user_first_touch_timestamp: this is the timestamp of the first_visit event. This field is available in all GA4 events.
user_pseudo_id: this is a unique id given by GA4 to the user (actually to the user’s browser where cookie is stored). This is also available in all events.
traffic_source: this is the source of user’s first visit, available in all events.
event_params.page_location: this is the page location where user landed in the first visit.
ga_session_id: this is the session_id of the first visit.
The event is available for > 99% of visitors. For the other 1%, we have to rely on other events and use ‘user_first_touch_timestamp’ to determine if it’s a new or old user.
Event: session_start
Trigger: Triggered when visitors starts a new session on the store, also triggered on the first session of a visitor.
But what is a session?
A ‘session’ tags continuous user activity on a website with one unique identifier. Each session on a website is a unique journey of 0-10 minutes (can be more) which started on one page and ended on another. All the metrics we calculate are just ways of summarizing sessions.
But a session must have a beginning and an end. Typically, a session ends if user is inactive for some time (30 minutes). A session also ends if user closes the browser.
Once a session ends, user’s next visit creates a new session.
According to GA4 documentation –
If there is a gap of 30 minutes between user activity, GA4 marks it as a new session. So a visitor landing on your website from 2 Instagram ads will have same session id if the second click is within 30 minutes of the first and different session_id if more than 30 minutes have passed
if user closes your website’s tabs or the browser, then the next visit gets tagged as a new session – even if it’s after a 1 minute gap.
if user is on your store on mobile and desktop at the same time – this will be counted as two sessions.
We always analyze user behavior by first creating a session level picture and then aggregating up from there. This is why understanding sessions is critical for analysts.
Key fields from the event:
ga_session_id
session_source
page_location
Data Collection
Gone are the days when you could ignore data collection. To work effectively with website data, you must understand how GA4 collects data.
How does GA4 work?
Cookie time. You must have seen those irritating consent popups when you visit any EU/US based website. Those are asking for your permission to store cookie on your device. Don’t be fooled by the name though, this cookie is just a text file that a website can maintain on your device and update from time to time.
When you visit the site again, the site can lookup the cookie it stored, and read whatever it had stored about you. Then it can customize the website, log you in automatically, or do nothing.
GA4 relies on cookies to tag a user as new or returning. When a new user lands on the store, Google Analytics will store a cookie on the browser – if it is allowed to. When the user visits again, GA4 will find the cookie on the browser and tag the user as returning. It will NOT send the first_visit event.
This is the root of problems in the privacy era. This, and the fact that people don’t really log in to shopify stores. So we can’t rely on login details either except for buyers – something we will deal with in the last post of this series.
Issues with cookies
Cookies worked very well till the early 2010s – before mobile phones replaced desktops for casual browsing, and before instagram and youtube became primary channels of marketing.
Now people don’t like to be tracked anymore (who can blame them?), so they have become bitter to cookies:
ad blockers, privacy-first browsers and privacy settings on the popular browsers block GA4 and 3rd party services from saving a cookie.
the cookie on mobile browser (say chrome) is not available to the browser that opens instagram ads (android webview).
Reinstall or clearing data from the app (instagram) or the browser can delete cookies
Responding ‘Reject All’ to consent popup prevents GA4 from adding a cookie.
and then there’s GDPR (for EU based stores) – with those consent popups. If users reject tracking, cookies won’t be setup on their devices
In all these instances, GA4 tags the visitor as ‘New’! Now, do you understand why the ‘New’ users are almost the same as total users? Because only a small fraction can be tracked as returning.
In such cases, GA4 has no way of knowing whether a user is visiting your store for the first or tenth time. GA4 keeps triggering the first_visit event.
It’s a mess.
In most setups, 90% or more users are tagged as New. However, what % are actually new is impossible to find out. The percentage of ‘New’ is significantly lower for older brands with high volume of returning customers.
Impact of this issue on numbers:
New and Returning user counts are unreliable
New User numbers are highly exaggerated: Same user on different devices, mobile and desktop, ad channels ( instagram ads and youtube ads) will appear as 4 users. This means your ‘new users’ count could be much smaller than what’s showing up on the dashboard.
Sessions to User ratio is generally around 1 – implying that no one returns to the store.
Workarounds
Move to session analytics
In the past, when user numbers were reliable, we could trace a user across multiple sessions and understand their journeys. That’s what we did (or tried to do). The unit of analysis was user.
We can’t rely on user anymore. So, we have moved the unit of analysis to sessions.
A session is now the most complete unit of user behavior available to us. To understand user behavior on the store, we have to get what we can from sessions. In this series (and on AhaInsights in general), we focus on session level analysis and reports.
How to share numbers:
Avoid sharing ‘exact’ numbers of new and returning users with your stakeholders. Always mark them as approximate.
If you are analyzing user behaviour on a channel-device combination (instagram + mobile) – the numbers are more reliable.
While the number of returning user is underestimated, the users tagged as returning are correctly tagged – this is a useful cohort for analysis.
You Can use these as filters in analysis reports -> sure your numbers are not exact, but new users still have majority of ‘new’ and returning users are all returning users.
Data Models
Data Model: Sessions Details
Model: session_details
Description: Contains details of each session. Note that GA4 reports multiple utm source values for each session – traffic_source, collected source, source, etc.. We are interested in ‘source’ – which is the source corresponding to the session.
Column Name
Description
ga_session_id
unique session identifier for the user
user_id
unique identifier of the user
session_start_time
Timestamp of the first event with this ga_session_id
session_end_time
Timestamp of the last event with this ga_session_id
session_source
utm source for the session.
session_medium
utm medium for the session
session_campaign
utm campaign for the session.
session_campaign_id
utm campaign id for the session.
session_duration
total duration of the session, in seconds.
landing_page_og
The URL of the page where the session started. Taken from the page_location of the first event in the session.
landing_page
Cleaned URL of the landing page. We remove everything after ‘?’ except variant id.
engaged_session_flag
A boolean field that indicates if it was an engaged or non-engaged session (bounce). This is taken from GA4’s engaged_session event param.
session_with_key_event
A boolean field that indicates if user performed a key event – add to cart, checkout initiation or purchase – during the session.
device_category
Device category of the user (desktop / mobile / tablet)
geo_country
Country from where user has accessed the site
geo_region
Region from where user has accessed the site
geo_city
City from where user has accessed the site
Data Model: User Details
As explained above, user is not a very reliable entity in data now. Nonetheless, keeping a user table helps us conduct some analysis on the returning users.
Model: user_details
Description: The master table of users who visited the website.
Column Name
Description
user_id
Unique user identifier, taken from user_pseudo_id field in GA4 export.
first_session_id
Identifier of the first session of the user on the website.
first_visit_ts
Timestamp of the first_visit event of the user, or user_first_touch_timestamp from GA4 export if first_visit event is missing.
traffic_source
utm_source for user’s first website visit, from ‘traffic_source’ field in GA4 report.
traffic_medium
utm_medium for user’s first website visit
traffic_campaign_name
utm_campaign for user’s first website visit
traffic_campaign_id
utm_campaign_id for user’s first website visit
device_category
User’s device category
device_brand_name
User’s device brand name
device_operating_system
User’s device OS
geo_country
User’s country – from first visit event.
geo_region
User’s region – from first visit event.
geo_city
User’s city – from first visit event.
sessions
Number of sessions by the user on the site
last_active_ts
Timestamp, in micros, when last session ended.
FAQs
Is ‘session_start’ event always available? What to do if session_start event is missing?
No, the event is not always available. It is not available for a very small percentage of data (<1%). But ga_session_id if present in all events as a event_parameter even if the session_start event is missing. ga_session_id is the timestamp of the session start time in seconds. So, when building the data model, we don’t filter for session_start event. We take all events and we get all the sessions from the event parameters ga_session_id parameter.
What is session source, how is it different from utm source?
GA4 defines session source as last non-direct click in the past 90 days. So if a user comes to your website through a referral, marketing channel or an organic search, subsequent direct visits will be tagged to the previous channel. This is in line with how Shopify reports orders and revenue on it’s dashboards. Since marketing platforms like Meta Ads take credit for a purchase in a 30 day window, this keeps the data consistent across platforms. However, you can use the utm_source field page_referrer event parameter to get the source of any session.
what is engaged session?
According to GA4 documentation, engaged session is one with more than 10 seconds on the platform, or 2 clicks, or 1 key event. By default, only ‘Purchase’ is considered as a key event but you can add more from the GA4 console.